Author: Matt Sowden

  • Introducing Aegis Analytics 3.0 – Sumatran

    Introducing Aegis Analytics 3.0 – Sumatran

    The future is now with Aegis Analytics v3.0, Sumatran. Take a deep dive into the biggest parts of our newest release and the industry-first features we’re bringing to the table of Project Controls. We think you’ll be just as excited as us when you see what is possible with v3.0.

    The Reactive Risk Register. First of its kind.

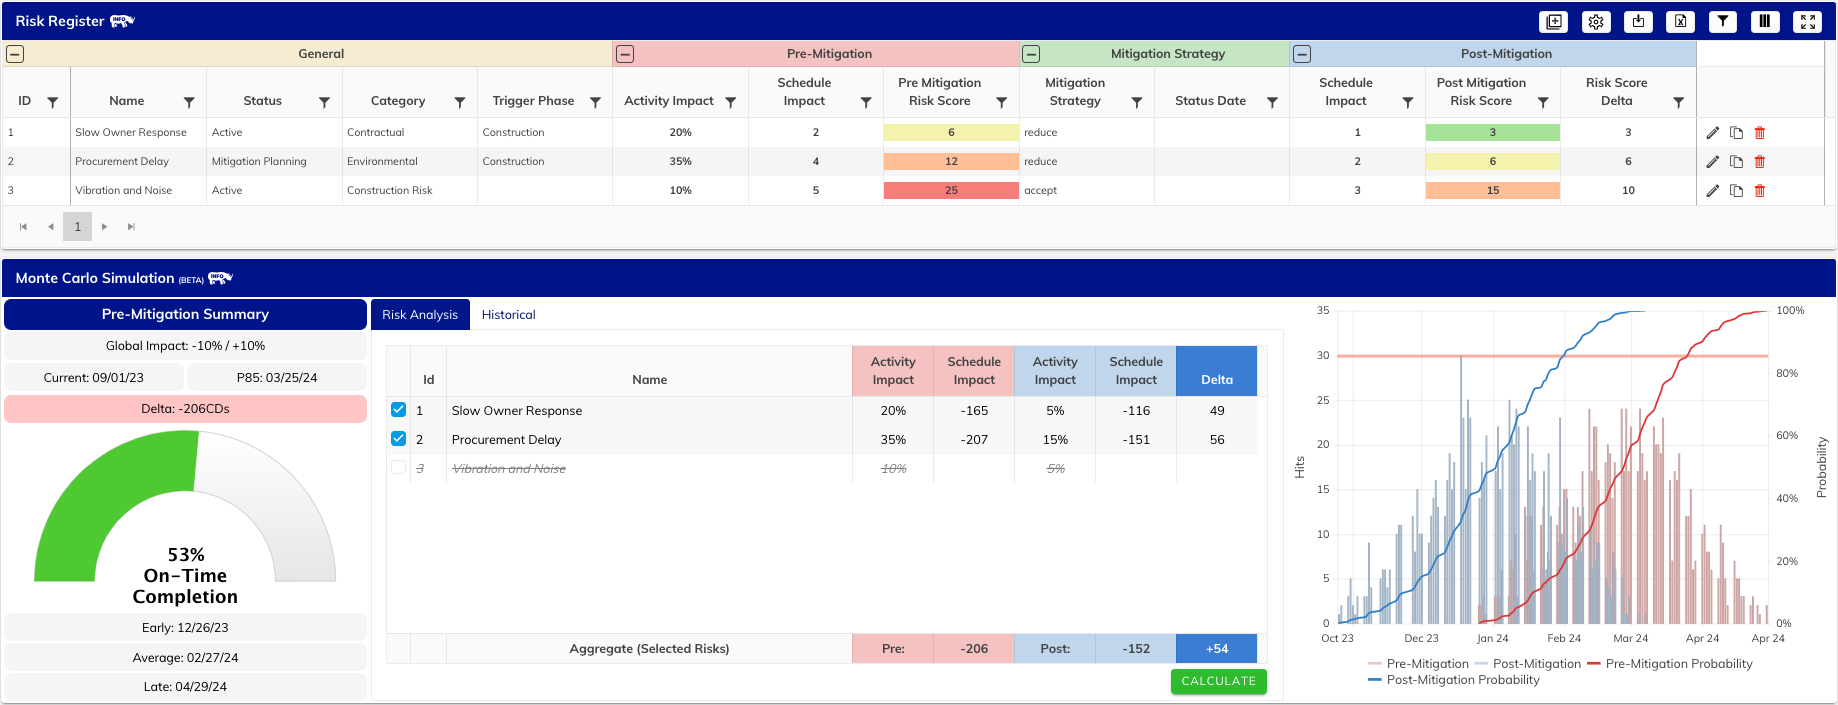
    Headlining our 3.0 release is the introduction of the Reactive Risk Register (R3). Our cloud-based risk register was built by risk professionals for our clients. Our risk register integrates directly with both your portfolio dashboard and your project schedules to provide on the fly monte carlo computations for the projects and risks you’re tracking.

    Risk Assignment and Mitigation Analysis. A well-paired match.

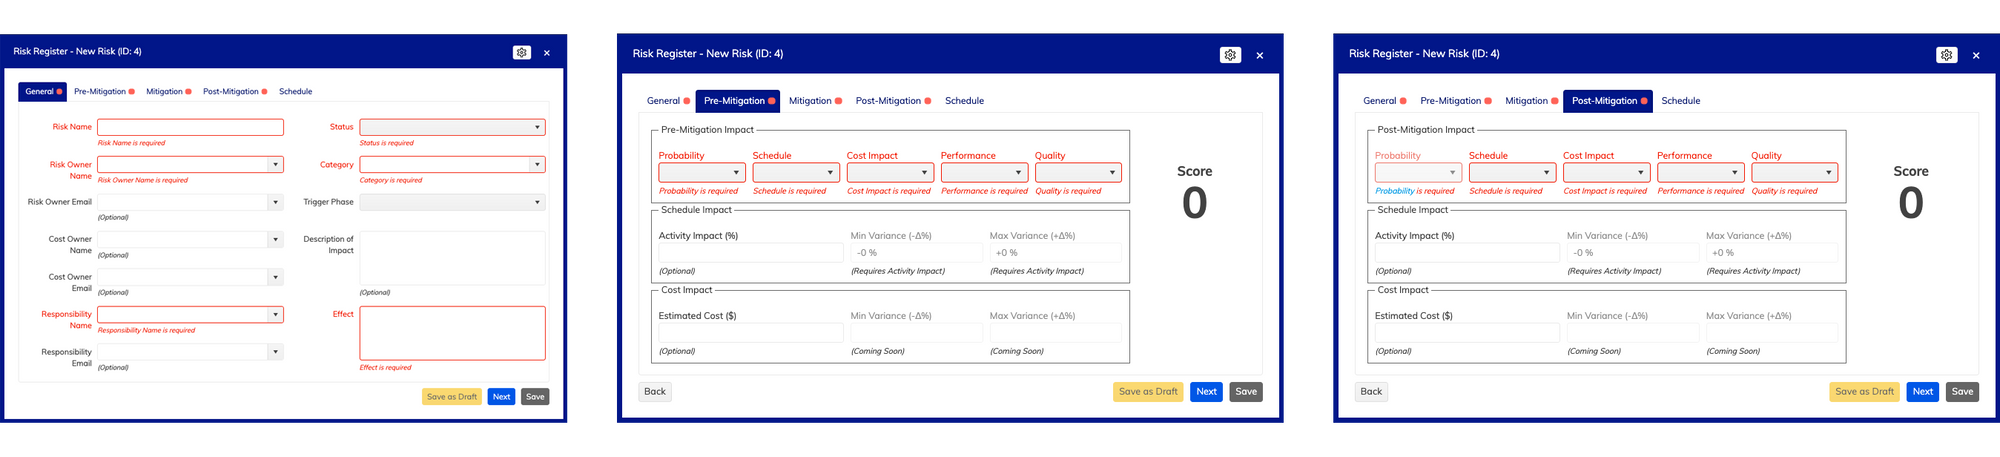
    Set risk ownership and tracking details in our easy-entry form, then determine pre-mitigation and post-mitigation scores to accurately compute the risks on your project.

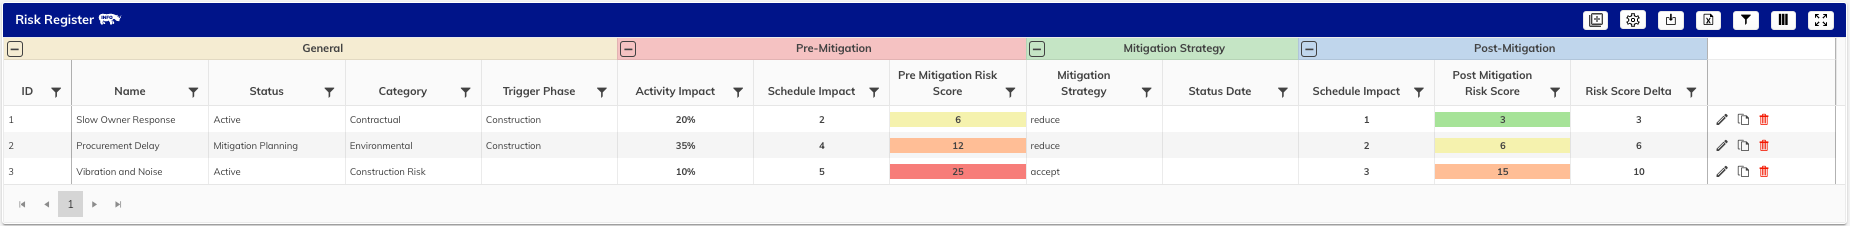
    Our Reactive Risk Register computes both the pre-mitigation and the post-mitigation scenarios of your project. It provides you with an understanding of the aggregate impacts of all the risks and the detailed impacts of each individual risk.

    Aegis Analytics gives you the information you need to determine the most critical risks on your project to create an impactful mitigation plan. Spend your time, money, and effort on the risks and mitigation plans that make the biggest difference on your project.

    Customization to make our Risk Register, yours.

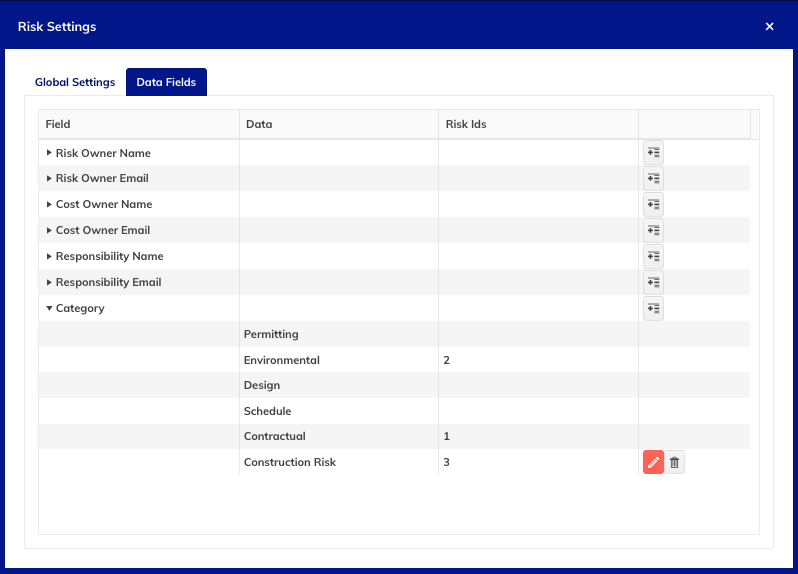
    Configure global settings and data fields to manage how your risks affect the overall performance of your schedule. Customize column layout and even take your data with you for a clean printout. Our goal is to make your Risk Register yours and cut out the bloat experienced with other products and get you to the part that matters most: visible, easy analysis of risk impact.

    Cloud Monte Carlo Analysis with Superpowers.

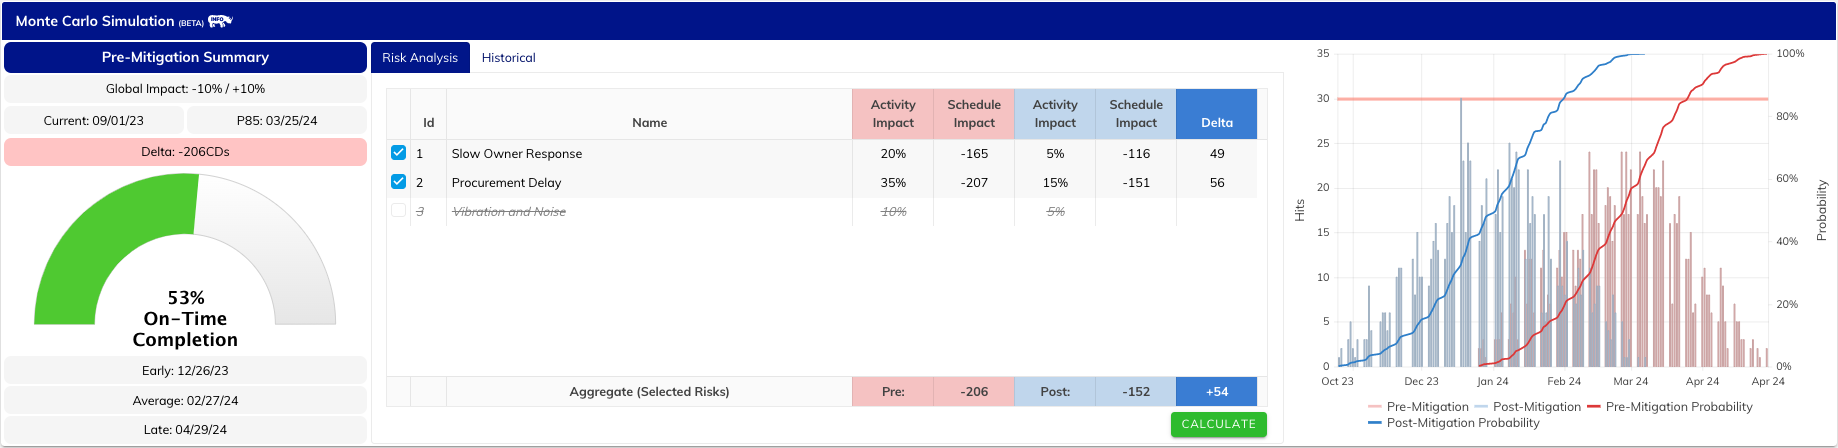
    With this release, we’ve supercharged our Monte Carlo simulator with tight integrations into your Risk Register. Attach risks to schedule activities and run your analysis based on tracked risks. We even provide on-the-fly toggles to enable or disable risk impacts to view any combination of simulations that you envision. The data is at your fingertips.

    Mitigations, visualized. Finally.

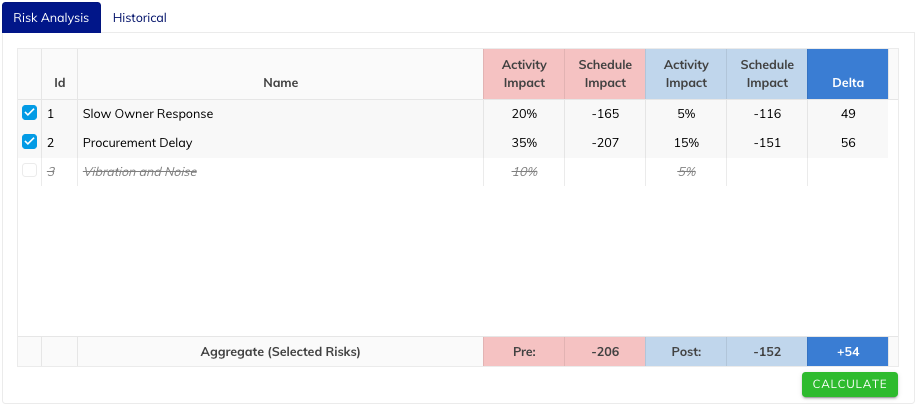
    Mitigation Plans have often historically been kept as separate documents with no easy way to simulate their impact on schedule performance. No more. Our Reactive Risk Register now provides pre- and post-mitigation analysis of your impacts. Our Reactive Risk Register not only computes the aggregate pre- and post-mitigation impacts to your project, but also the individual contributions of each risk.

    Historical Analysis so History never Repeats.

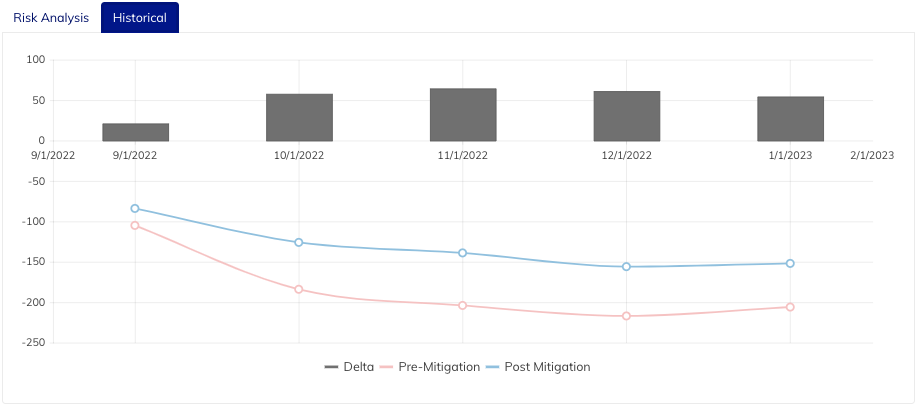
    They say the best way to succeed is to learn from the mistakes of the past, and we’re enabling you to do that with our Historical Analysis feature. Review your project’s historical performance based on your risk metrics to ensure that your mitigation plan is on track.

    We track with our competition. And Speed Past.

    Compared with our contemporaries, we think you’ll find that our simulation is not only tailored for the professional project controls engineer, it’s the preferred method of simulating risk.

    Free for our clients!

    As always, Aegis Analytics and all of its features, including the Reactive Risk Register, is free to all Aegis clients. Reach out to your client representative to get more information. If you’re not a client but interested in demoing our product, please contact sales@consultaegis.com

    Want to learn more?

    You can review our full release notes here: https://news.rhino.works/aegis-analytics-v3-0/

  • Aegis Analytics v2.1

    Based on the tremendous success and engagement from our customers, we’ve released Aegis Analytics v2.1 which improves our Analytics dashboard in several key ways we think you’ll love.

    What’s New?

    • We’ve added Logic Density, Hard Constraints, and Out of Sequence metrics to our Schedule Analysis breakouts on the Quality Control page. These breakouts are also available in the Excel Export.
    • We’ve added the DCMA 14-Point Assessment to the Quality Control page for each project to measure schedule health and quality more effectively against known industry standards.
    • Implemented vastly improved schedule processing to take the rendering time of an uploaded schedule down from minutes to seconds for most schedules.
    • We’ve added better communication methods in our application to inform users of upcoming maintenance or potential downtime. You can still visit our status page any time at https://status.rhino.works/
    • Improved the login process for all users to cut down on load times after login.

    Better metrics. Happier customers.

    We’ve added more metrics in our Schedule Analysis to make it easier for you and your customers to identify schedule health issues and fix problems faster. Logic Density allows you to see the ratio of activities to relationships at a glance and determine schedule complexity on the fly. Hard Constraints and Out of Sequence metrics are now divable and can give you a glimpse into where your schedule may need additional tweaking.

    Industry standards that come standard.

    The Defense Contract Management Agency 14-Point Schedule Assessment is now available on the Quality Page of every project. The DCMA 14-point Schedule Assessment set of criteria was formed in 2005 and firstly it was used by the US Department of Defense. Since then it had become a guideline for schedule review which has been implemented in many project management software widely used in the aerospace and defense industry.

    Ready. Set. Analyze.

    We’ve made major improvements to our schedule analysis processors that improve processing times on 95% of schedules uploaded to our platform. Spend less time waiting and more time analyzing.

    So much more to come.

    From login improvements to under the hood tune ups, v2.1 prepares us for the next round of upgrades and even more beyond that. We can’t wait to share the next release with you.

    How to upgrade to v2.1

    Visit dashboards.consultaegis.com today. The new update will be applied once you refresh.

  • Introducing Aegis Analytics v2.0

    Aegis Rhinoworks is Proud to Unveil Aegis Rhinoworks version 2.0. A culmination of a year and a half of rework, updates, and feedback implementation from our users culminating in the best construction analytics platform on the market.

    What’s new?

    • We’ve given the product a major facelift, improving usage and showing off our new Logo
    • Schedule Analysis in Quality Control can now be interacted with and searched through to pinpoint tasks and relationships causing issues
    • We’ve improved the performance of the UI and Report Generation to ensure speed and accuracy.
    • Schedule uploads can now be downloaded, edited, replaced, or removed. Analytics will now automatically sort all files by data dates for accuracy.
    • Introducing: Risk (BETA)! Along with our highly curated risk metrics thanks to our partners at Aegis Dispute Resolution, we also include a Monte Carlo simulator for predictive analysis of your schedule based on past performing factors. The simulation, while similar to offerings in Primavera Risk Management, cuts the simulation time down dramatically and does not require a dedicated piece of software to perform.

    Dashboard Metrics just got a whole lot prettier.

    • We’ve completely overhauled the header bar for project pages. In addition to important metric tracking and a quick glance at project health from various different scopes, a minimized version of the same data will stay at the top of the page no matter where you are for better referencing.

    Introducing the brand new Schedules Tab

    Review, manage, and download your project’s XER schedules all in one place

    • Update notes can now be edited
    • Automatically inserts schedules in correct sequence based on Data Date
    • Make multiple changes/edits, and save changes
    • Export the current schedule list

    Welcome to a world without Desktop Risk Applications. Welcome to Aegis Risk Analysis.

    Working hand in hand with our Risk & Dispute Resolution team, we’ve created a fantastic piece of software that rivals the competition with ease of use and convenience. Simulate Monte Carlo statistical probabilities on the go, find out when your project is likely to finish, and get an in-depth look as to the real health of your project with Aegis Risk Analysis.

    Monte Carlo Simulation (BETA)

    The Monte Carlo Simulation utilizes as-built performance data to determine the likelihood of finishing on or before a particular date. By comparing this to the contractual completion date, a level of risk can be determined based on the potential for delay.

    While competitor programs utilize desktop-based software that require a specific operating system, our simulation software can be run on any device right from your web browser!

    Critical Path Risk (BETA)

    • The Critical Path Risk component is derived from the Critical Path (CP) and the Secondary (SCP) and Tertiary (TCP) paths.
    • Analyzing the Critical Path and sub-critical paths provides valuable trending and stability information. It provides the Project management team a tool to evaluate its current and future forecasts. With each update, the Project will be provided trends which will give the team the ability to understand and prepare for current and potential CP risk factors.

    Critical Path Reliability (BETA)

    • Critical Path Reliability assesses the reliability of the critical path by measuring the consistency of the activities on the critical path and logic ties between them.

    The overall score for Critical Path Reliability is an average of the Activity Consistency and the Logic Consistency.

    • Activity Consistency gauges if critical activities remain critical, with a zero indicating a total path change and 100 indicating an identical path between the schedules, after correcting for completed activities.
    • Logic Consistency measures changes in the driving logic ties along the critical path of both the base schedule and the update. The values of the base logic and update logic are averaged for an overall Logic Consistency score.

    Go more in depth with detailed Schedule Analysis breakout lists in Quality Control

    NEW – Schedule Analysis

    • Based on feedback from Aegonians and Clients, we’ve expanded how you can interact with our schedule analysis in a big way!
    • You can now see the activities included in each analysis group. Select a group to review the activities/relationships associated, or export the full Excel report for analysis
    • Need to find a specific activity or relationship? Use the search bar above the table to narrow down to a specific task name or code.

    Revamp of the Project Portfolio Page

    • Added “Projects On-Track”
    • All Top-row visuals now filter the Project List when clicked
    • Important metrics are now visible right from the project’s listing and can be sorted and filtered.
    • Project list selections provide a snapshot of that project’s performance
    • The arrow to the right launches directly to that project’s dashboard

    Updates to the Project Overview Screen

    Milestones Chart

    • Selected Milestones are now all displayed on a single chart, with the option to select/de-select specific milestones for direct or overall comparison